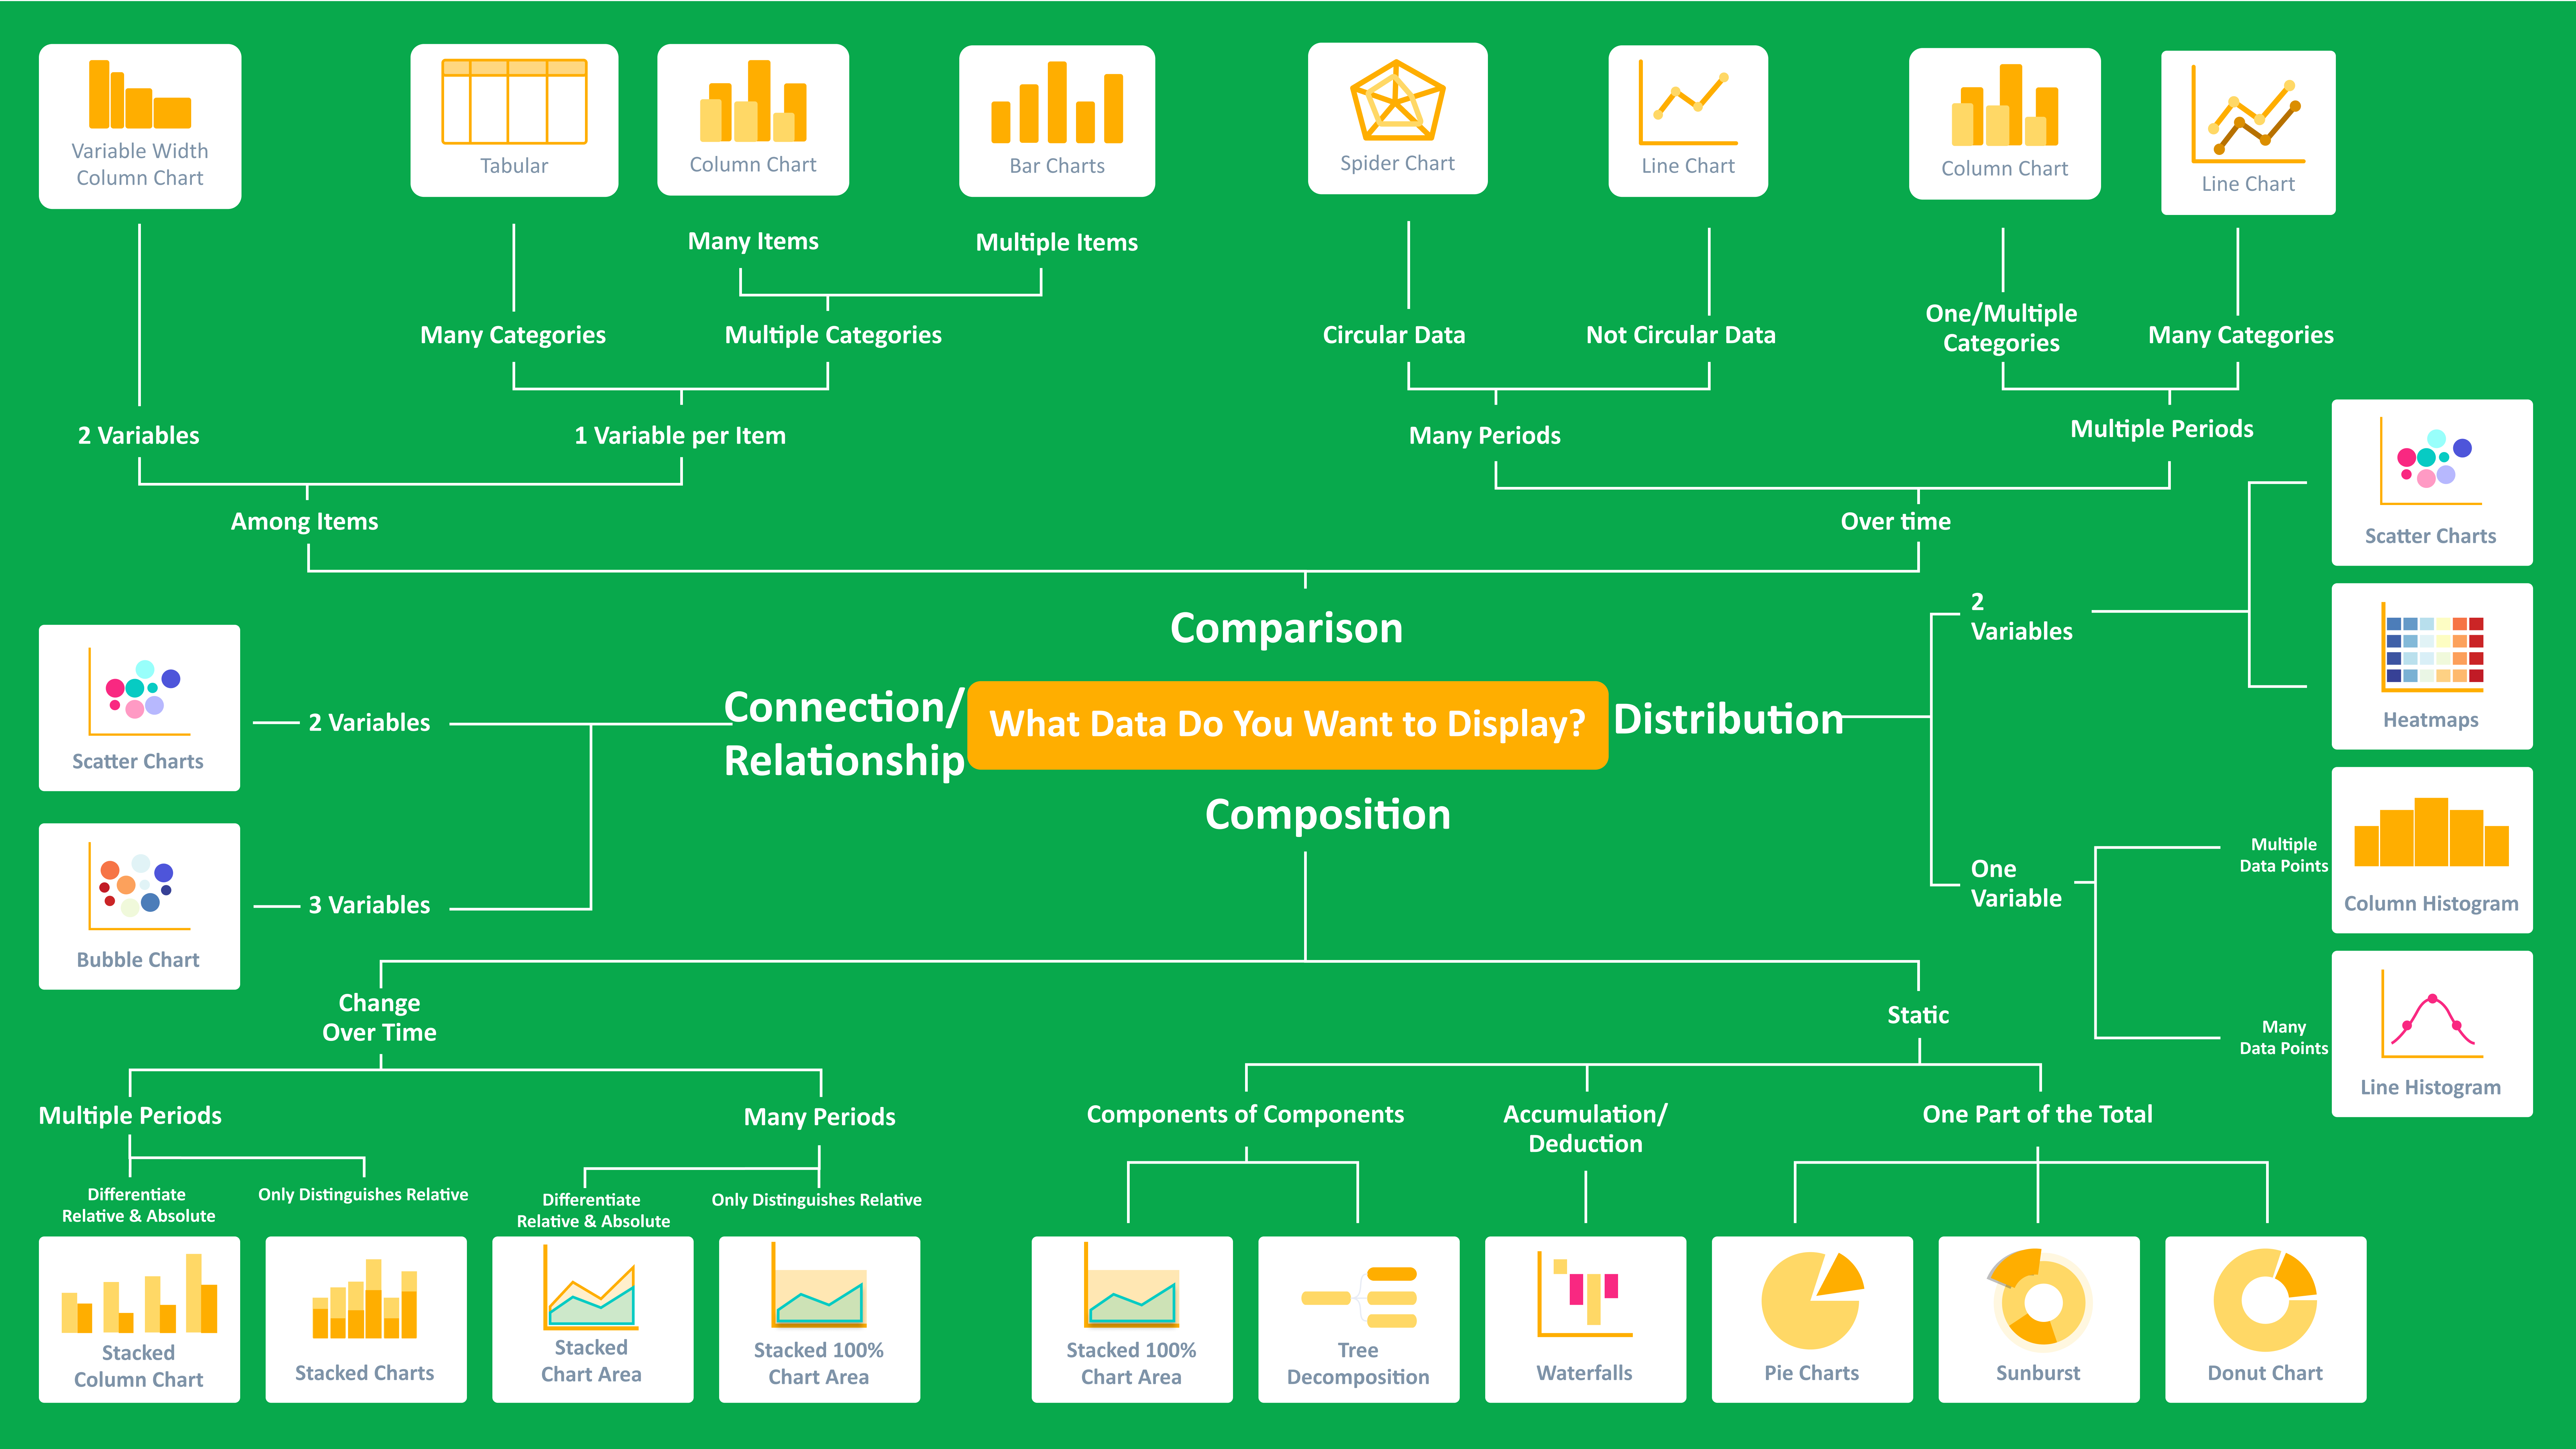
Chart Selection Guide
Choosing the right chart type is essential for effectively communicating your data and making it easy for your audience to interpret. With various chart options available, selecting the most suitable one depends on your specific visualization goals and the nature of the data you wish to present. This guide is designed to assist you in identifying the optimal chart type, ensuring clarity and accuracy in your data storytelling.