Spider Chart
Anatomy
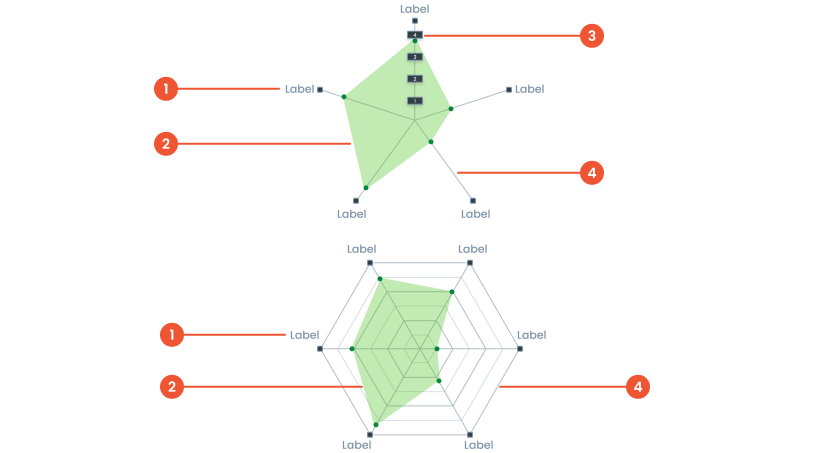
Text on a chart refers to any written information or labels included in a chart to provide context, describe data, or improve the readability and understanding of the visualization.
Is a type of chart used to represent multivariate data. It is displayed as a web-like or spider-web shape where data points are plotted along multiple axes radiating out from a central point.
Refers to the starting value of the scale used to plot data along the chart’s axes. This number determines the point from which data begins to be plotted on each axis.
A line connecting points on a chart. that represent data value
Guidelines for Spider Charts
- The minimum number of data points is 3 metrics, and the maximum number of data points is 10 metrics."
- The Maximum number of Layers is 5 layers
- The Maximum number of characters is 15 characters per label
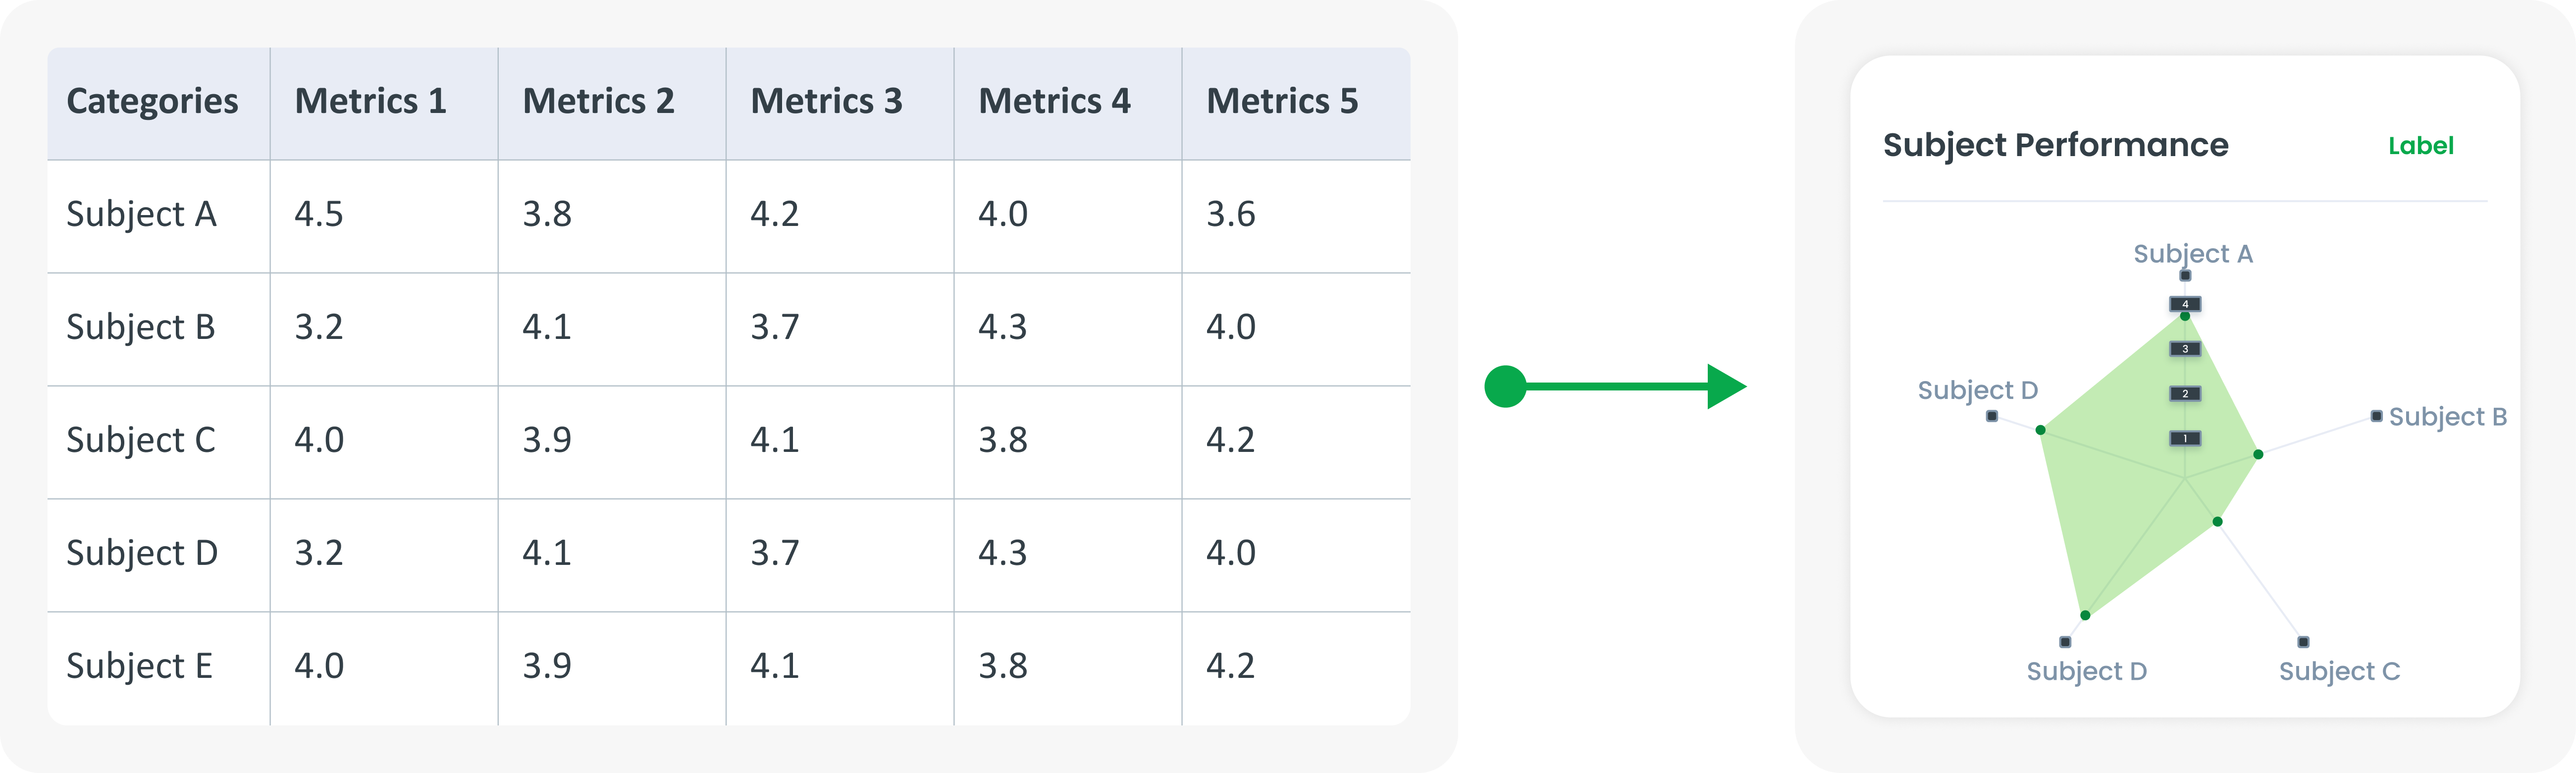
Example of Source Data
When to Use a Spider Chart?
- Compares several variables in various categories.
- Shows skill levels in various categories.
- Identifying strengths and weaknesses in a dataset.
- Displaying data with more than two dimensions.