Overview Data visualization color palette is designed to enhance readability and clarity in presenting information. Colors are important for showing differences between data points, highlighting important information, and guiding the audience's attention. Consistent application of colors makes it easy to understand the data, which reduces the effort needed to understand it while keeping everything visually balanced. To keep things clear and easy to understand, all colors should be used according to the rules for design, making sure everything align.
 Semantic ColorSemantic colors show why each color is used in data visualization. They help show the difference between elements based on their function. For example, they can highlight primary data points, secondary details, warnings, or critical insights to make data easier to understand.
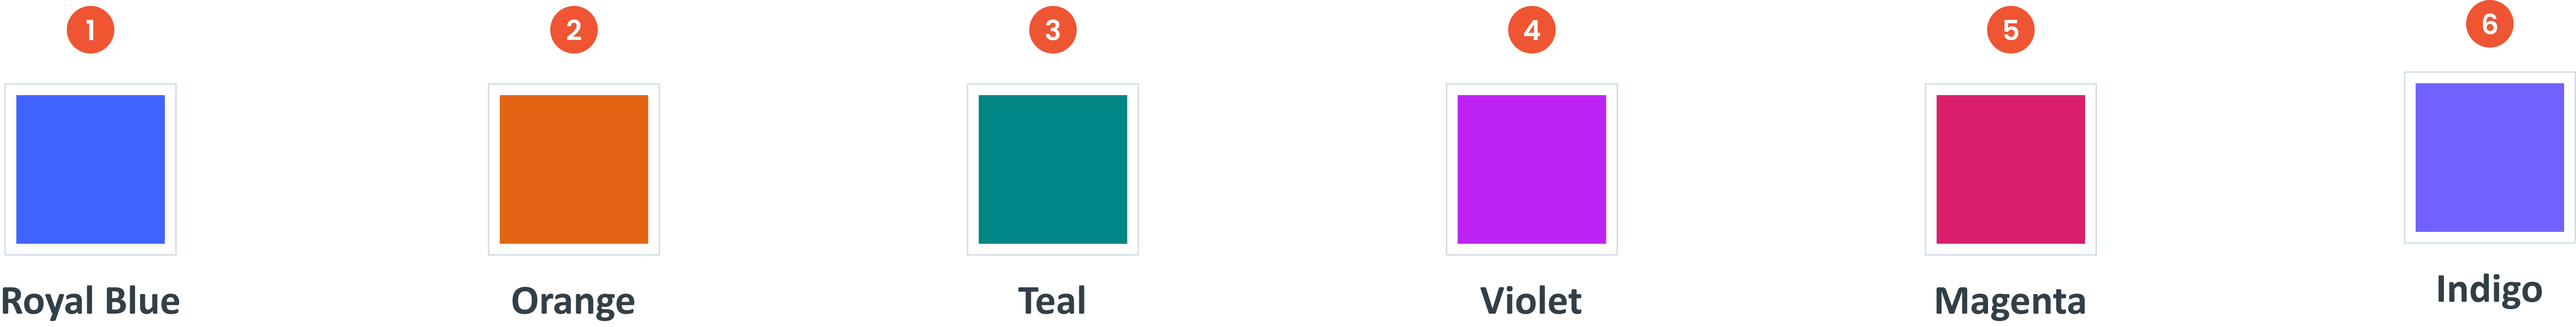
Main Data Color The main color for categorical data in charts helps make the different data groups stand out, ensuring each category is visually unique and easy to compare while maintaining clarity and balance.
Color Order Guidelines The use of color in the chart starts with the color Royal Blue for the main data, followed by the secondary color Orange. If additional colors are needed, use the sequence after. This is done to maintain contrast, readability and consistency.
Specialty Data Color Specialty colors are used for specific data types like cost, quantity, manpower, equipment, safety, production, achievement, and non-achievement, ensuring clear distinction and emphasizing critical insights in charts.
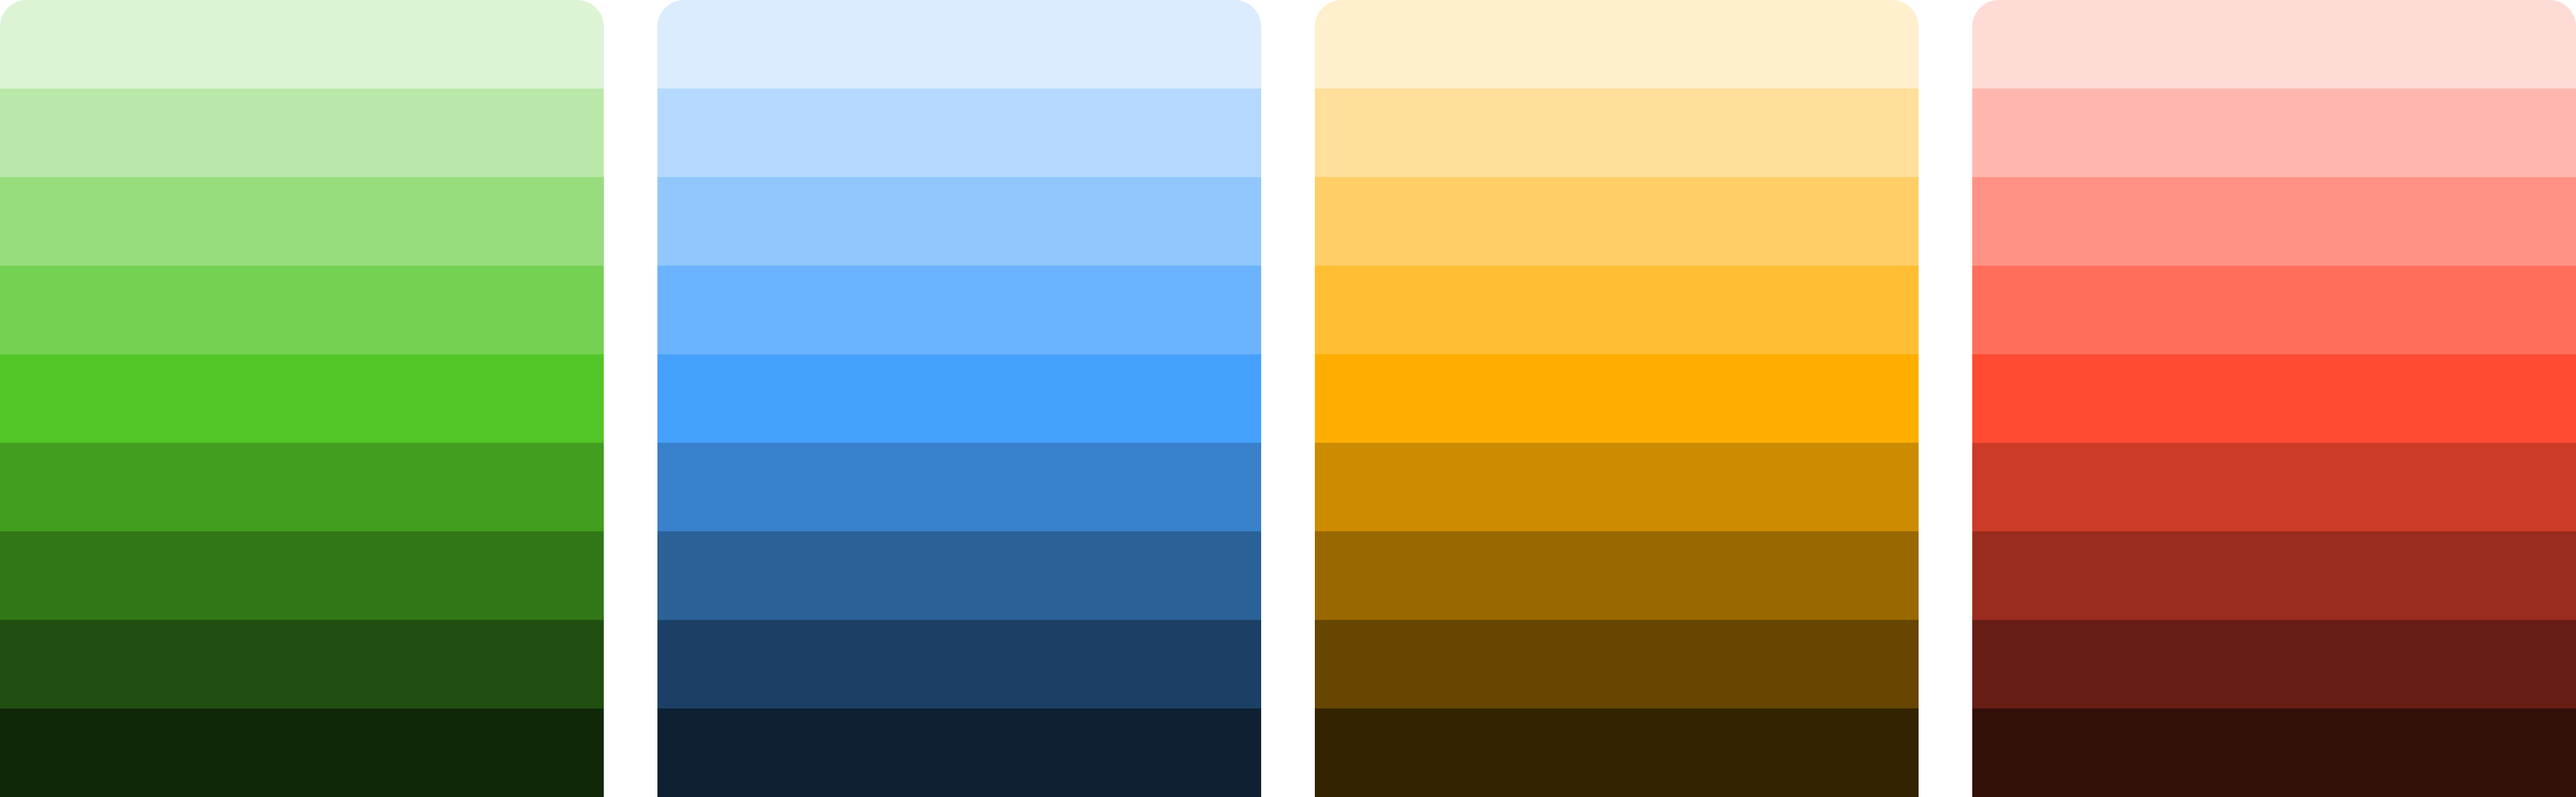
Sequential Color Sequential colors are used for representing data with a natural progression, such as ranges or gradients, where color intensity reflects the magnitude or value in the chart.
Diverging Color Diverging colors are used in heatmaps to show variations from a central point, using contrasting hues on either side to represent positive and negative values or differences in magnitude clearly.
Semantic ColorSemantic colors show why each color is used in data visualization. They help show the difference between elements based on their function. For example, they can highlight primary data points, secondary details, warnings, or critical insights to make data easier to understand.| Properties | Desc |
|---|---|
| Represents positive data, completed tasks, or successful outcomes, often shown in green for clarity. | |
| Used to draw attention to potential issues or risks that require caution, typically represented in yellow. | |
| Communicates neutral information, instructions, or updates to assist understanding, commonly shown in blue. | |
| Highlights negative data, urgent issues, or actions requiring immediate attention, often represented in red for urgency. |
Success
Success100
Hex
Success200
Hex
Success300
Hex
Success400
Hex
Success500
Hex
Success600
Hex
Success700
Hex
Success800
Hex
Success900
Hex
Warning
Warning100
Hex
Warning200
Hex
Warning300
Hex
Warning400
Hex
Warning500
Hex
Warning600
Hex
Warning700
Hex
Warning800
Hex
Warning900
Hex
Information
Info100
Hex
Info200
Hex
Info300
Hex
Info400
Hex
Info500
Hex
Info600
Hex
Info700
Hex
Info800
Hex
Info900
Hex
Danger
Danger100
Hex
Danger200
Hex
Danger300
Hex
Danger400
Hex
Danger500
Hex
Danger600
Hex
Danger700
Hex
Danger800
Hex
Danger900
Hex
Main Data Color The main color for categorical data in charts helps make the different data groups stand out, ensuring each category is visually unique and easy to compare while maintaining clarity and balance.
Royal Blue
RoyalBlue100
Hex
RoyalBlue500
Hex
RoyalBlue700
Hex
Teal
Teal100
Hex
Teal500
Hex
Teal700
Hex
Magenta
Magenta100
Hex
Magenta500
Hex
Magenta700
Hex
Orange
Orange100
Hex
Orange500
Hex
Orange700
Hex
Indigo
Indigo100
Hex
Indigo500
Hex
Indigo700
Hex
Violet
Violet100
Hex
Violet500
Hex
Violet700
Hex
Color Order Guidelines The use of color in the chart starts with the color Royal Blue for the main data, followed by the secondary color Orange. If additional colors are needed, use the sequence after. This is done to maintain contrast, readability and consistency.
Specialty Data Color Specialty colors are used for specific data types like cost, quantity, manpower, equipment, safety, production, achievement, and non-achievement, ensuring clear distinction and emphasizing critical insights in charts.
Cost
Cost500
Hex
Quantity
Quantity500
Hex
Manpower
Manpower500
Hex
Equipment
Equipment500
Hex
Safety
Safety500
Hex
Production
Production500
Hex
Sequential Color Sequential colors are used for representing data with a natural progression, such as ranges or gradients, where color intensity reflects the magnitude or value in the chart.
Achieve
Achieve100
Hex
Achieve500
Hex
Achieve700
Hex
notAchieve
notAchieve100
Hex
notAchieve500
Hex
notAchieve700
Hex
Diverging Color Diverging colors are used in heatmaps to show variations from a central point, using contrasting hues on either side to represent positive and negative values or differences in magnitude clearly.
Diverging
-100
Hex
-80
Hex
-60
Hex
-40
Hex
-20
Hex
0
Hex
+20
Hex
+40
Hex
+60
Hex
+80
Hex
+100
Hex